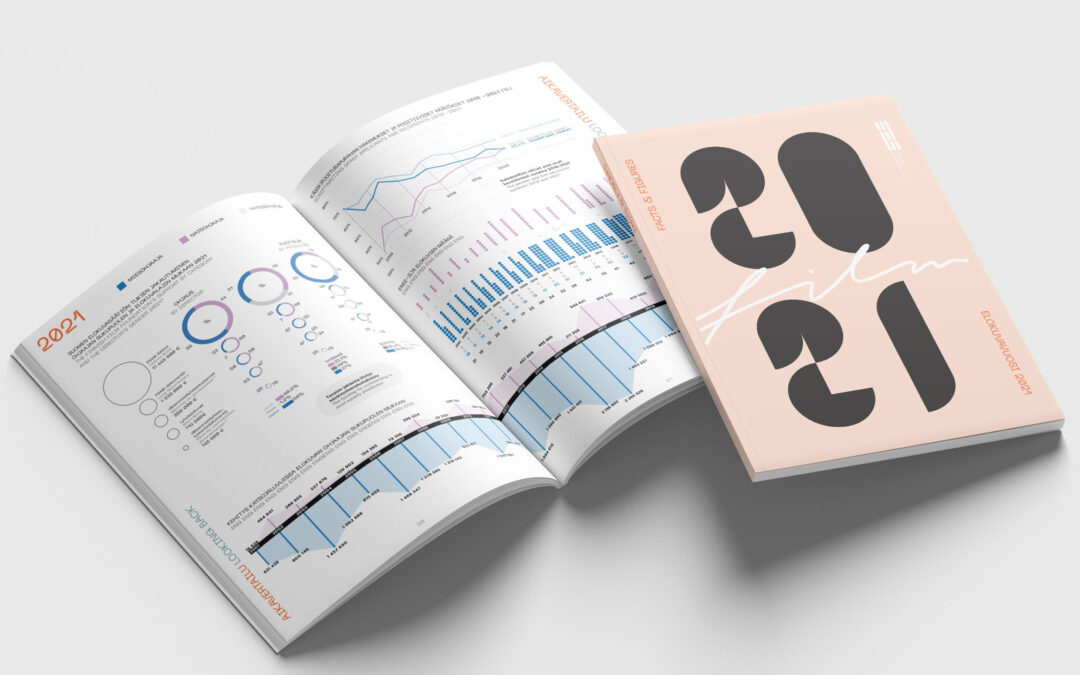
Here you go – all the figures you need to understand about film production in Finland in 2021. KRUT designed the visuals and report design for the Finnish Film Foundation’s yearly ”state of the industry”-style report last spring. In a way, the report is a...
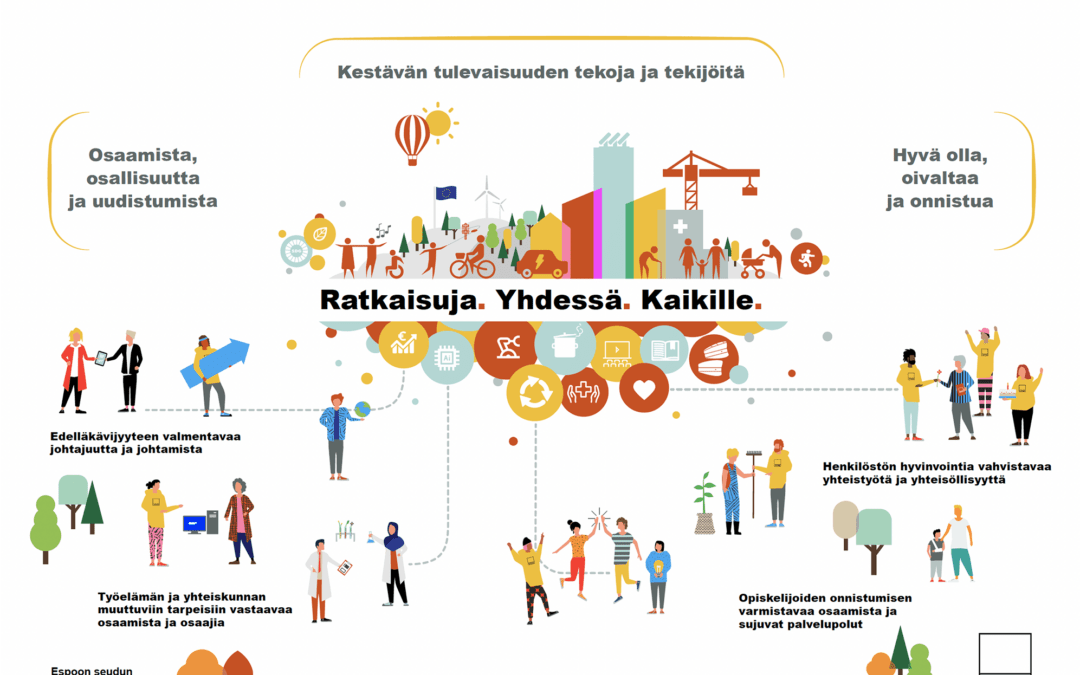
We’ve learnt a lot about information design when creating strategy visuals for public organisations and large-cap public companies in the last years. Above is one that the educational organisation Omnia has used since September 2022. In its strategy, the...
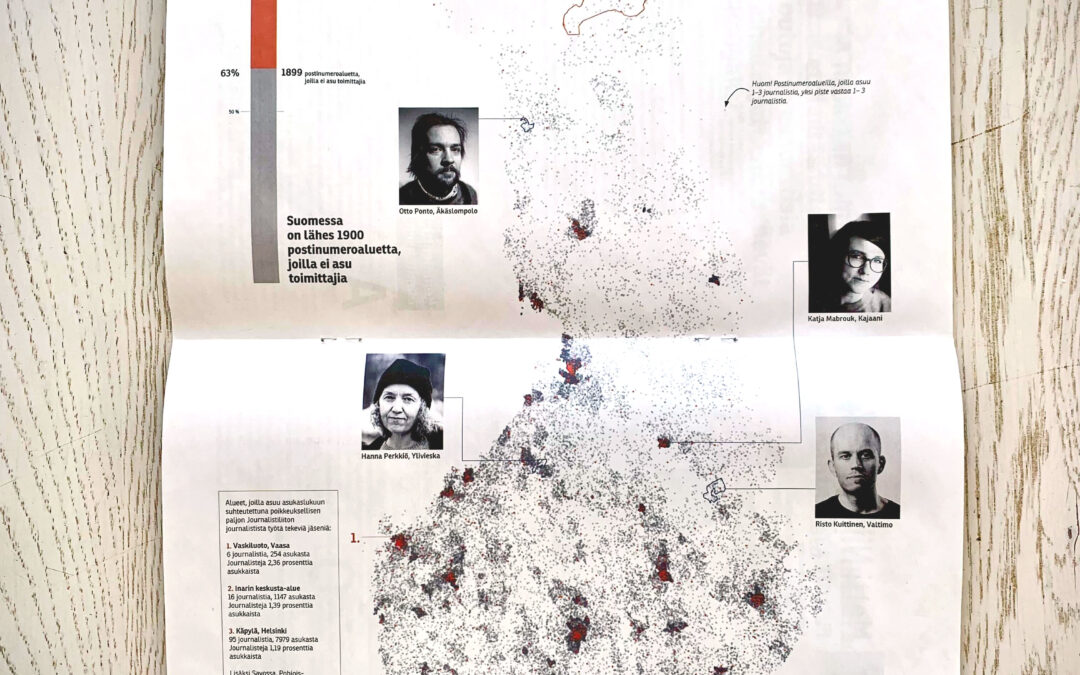
Exploring alternatives to choropleth maps (maps where areas are filled with colours according to data), we decided for a dot density map for Journalisti magazine, by the journalists’ union in Finland Journalistiliitto Journalistförbund. The data: population...
We are excited to launch our new company and product Ooooh. After being featured in too many magazines to mention and having created an online stir, we know that Ooooh is going to be big.